Leave Your Message
Renewable energy systems are becoming larger and more interactive, making clear inverter feedback increasingly useful. The International Energy Agency’s Renewables 2024 report projects nearly 5,500 GW of renewable power capacity additions worldwide between 2024 and 2030. Solar PV is expected to provide almost 80% of that growth. IRENA’s Renewable Capacity Statistics 2025 reports that renewable capacity rose by 585 GW in 2024 alone. These figures describe a fast-changing energy landscape, though they do not prove that every system needs the same display.
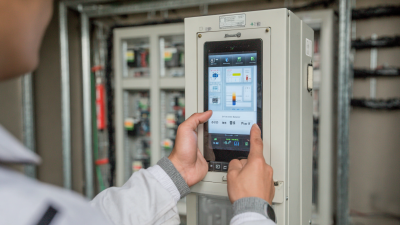
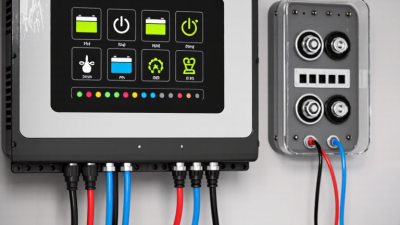
A Hybrid Inverter Display can help owners and installers understand what a system is doing at a glance. It may show battery state of charge, solar production, grid import and export, load demand, operating mode, and fault alerts. Yet a bright screen is not automatically a useful one. Small text, unclear icons, delayed readings, or confusing alarm codes can make routine checks harder. Real installations also vary: a display that works well in a bright utility room may be difficult to read outdoors.
This guide compares ten practical features, including screen readability, data accuracy, navigation, monitoring options, and alert clarity. The goal is not to crown one interface for every home. It is to identify what matters for your system and daily use. Some trade-offs remain. A simple screen can be easier to learn, but it may hide useful detail. That deserves a closer look.
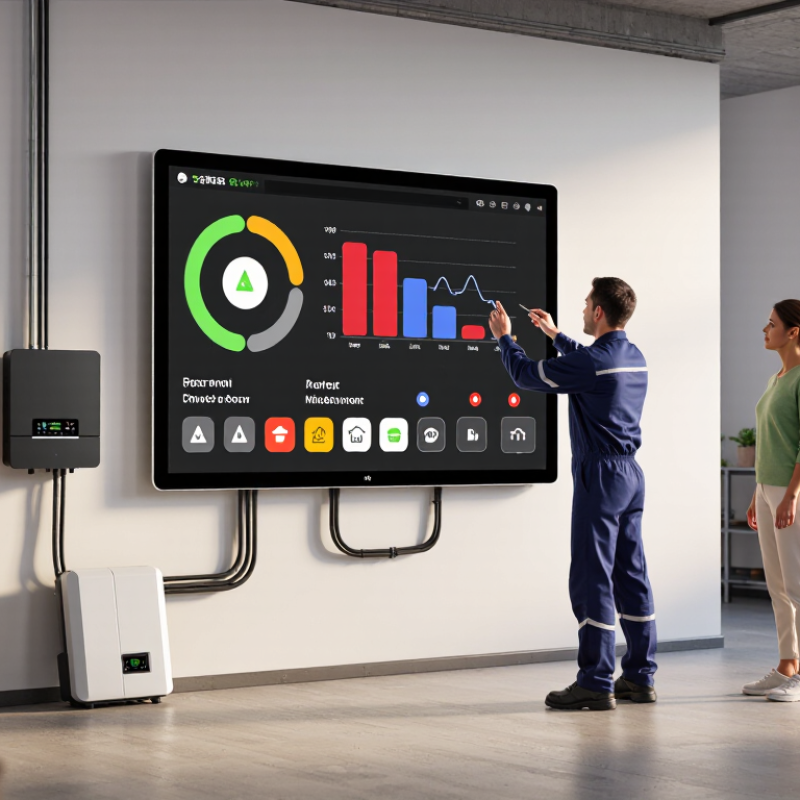
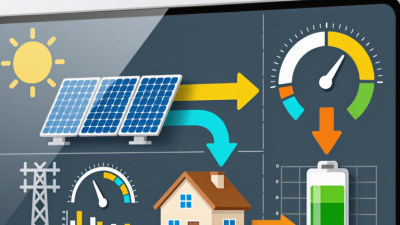
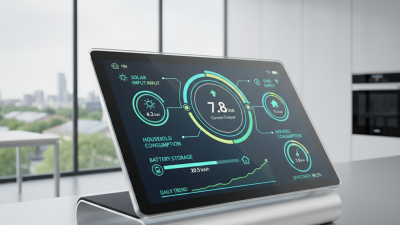
A hybrid inverter display makes invisible energy flows easier to understand. It can show solar generation, household demand, battery charge, grid import, and export in near real time. During a cloudy afternoon, these readings help explain why the battery is charging slowly or the home is drawing power from the grid. Small details matter: units, update frequency, and clear flow arrows can prevent a misleading first impression.
The scale of solar makes dependable monitoring increasingly relevant. IEA PVPS’s Snapshot of Global PV Markets 2024 estimates that cumulative global photovoltaic capacity reached at least 1.6 terawatts by the end of 2023. For an individual system, the display should make battery state of charge, operating mode, and active warnings easy to find. NREL’s 2024 Annual Technology Baseline uses about 85% round-trip efficiency for utility-scale battery storage; this is not a household inverter specification, but it shows why tracking energy in and out matters. Look for readable history, too. A live number is useful, but yesterday’s pattern can reveal recurring peaks. Still, displays are not perfect. Sensor delays or confusing labels can distort the picture, so compare readings with actual usage before drawing firm conclusions.
A hybrid inverter display can help you understand how solar generation, battery storage, household loads, and the utility grid are interacting. Compare the visibility and clarity of these readings—not just the number of items shown.
| Display Feature | What It Shows | Why It Matters | What to Compare |
|---|---|---|---|
| 1. Solar PV Power | Live power from the solar array, typically shown in watts or kilowatts. Some displays also show energy produced over a selected period. | Helps you see whether the system is generating power and how much solar energy is available at that moment. | Check for clear live readings, separate PV input readings where applicable, and daily or cumulative energy totals. |
| 2. Battery State of Charge | The battery’s estimated charge level, usually displayed as a percentage. It may also show battery voltage or remaining capacity. | Makes it easier to judge available stored energy and understand when charging or discharging is taking place. | Look for an easy-to-read percentage and clear indication of whether the value comes from compatible battery communication. |
| 3. Battery Charge and Discharge Power | The rate at which power is flowing into or out of the battery, commonly displayed in watts or kilowatts. | Shows whether surplus solar is being stored or whether the battery is supplying energy to loads. | Compare whether direction and power level are immediately clear, including when the battery is idle. |
| 4. Grid Import and Export | Power drawn from the utility grid or sent back to it, when grid measurement equipment and system configuration support those readings. | Helps explain whether the home is relying on grid electricity or exporting excess generation. | Check that import and export are shown separately and that the display identifies the direction of energy flow. |
| 5. Household Load | Estimated or measured power being used by connected household loads. The reading may depend on an installed meter or current sensor. | Allows users to relate solar production and battery output to current consumption. | Confirm whether load is measured directly or calculated, and whether the display explains when a reading is unavailable. |
| 6. Energy Flow Diagram | A visual representation of power moving among the PV array, inverter, battery, home loads, and grid. | A flow diagram can make system operation easier to understand than several separate numeric readings. | Compare the clarity of arrows, labels, units, and live values; avoid diagrams that make power direction ambiguous. |
| 7. Operating Mode | The current system state or selected operating mode, such as self-consumption, backup, or a scheduled charging mode, depending on the system. | Helps explain why the inverter is prioritizing a particular source or destination for energy. | Look for a plain-language mode label and an indication when a schedule or setting is affecting operation. |
| 8. Alarms and Fault Messages | Warnings, fault codes, or status messages related to the inverter, battery, grid, or connected equipment. | Timely, understandable alerts can help users identify a problem and know whether further support is needed. | Compare message clarity, fault-code descriptions, and whether the display distinguishes active faults from historical events. |
| 9. Electrical Measurements | Values such as AC voltage, frequency, current, or DC input measurements, depending on the inverter and its monitoring setup. | These readings can help installers or qualified service personnel assess operating conditions and investigate issues. | Check which measurements are available, whether units are shown, and whether readings are clearly separated by input or output. |
| 10. Historical Energy Data | Recorded energy totals, often organized by day, month, or lifetime, for PV generation and sometimes battery or grid activity. | Provides context for system performance beyond a single live reading. | Compare available time ranges, readable summaries, and whether the display identifies which energy totals are measured or estimated. |
Note: Available readings and their accuracy depend on the inverter, connected battery, meters or sensors, system configuration, and software. A display may not show every value unless the required equipment is installed.